July 14, 2022
IndustrySector Scoring by Jusan Analytics
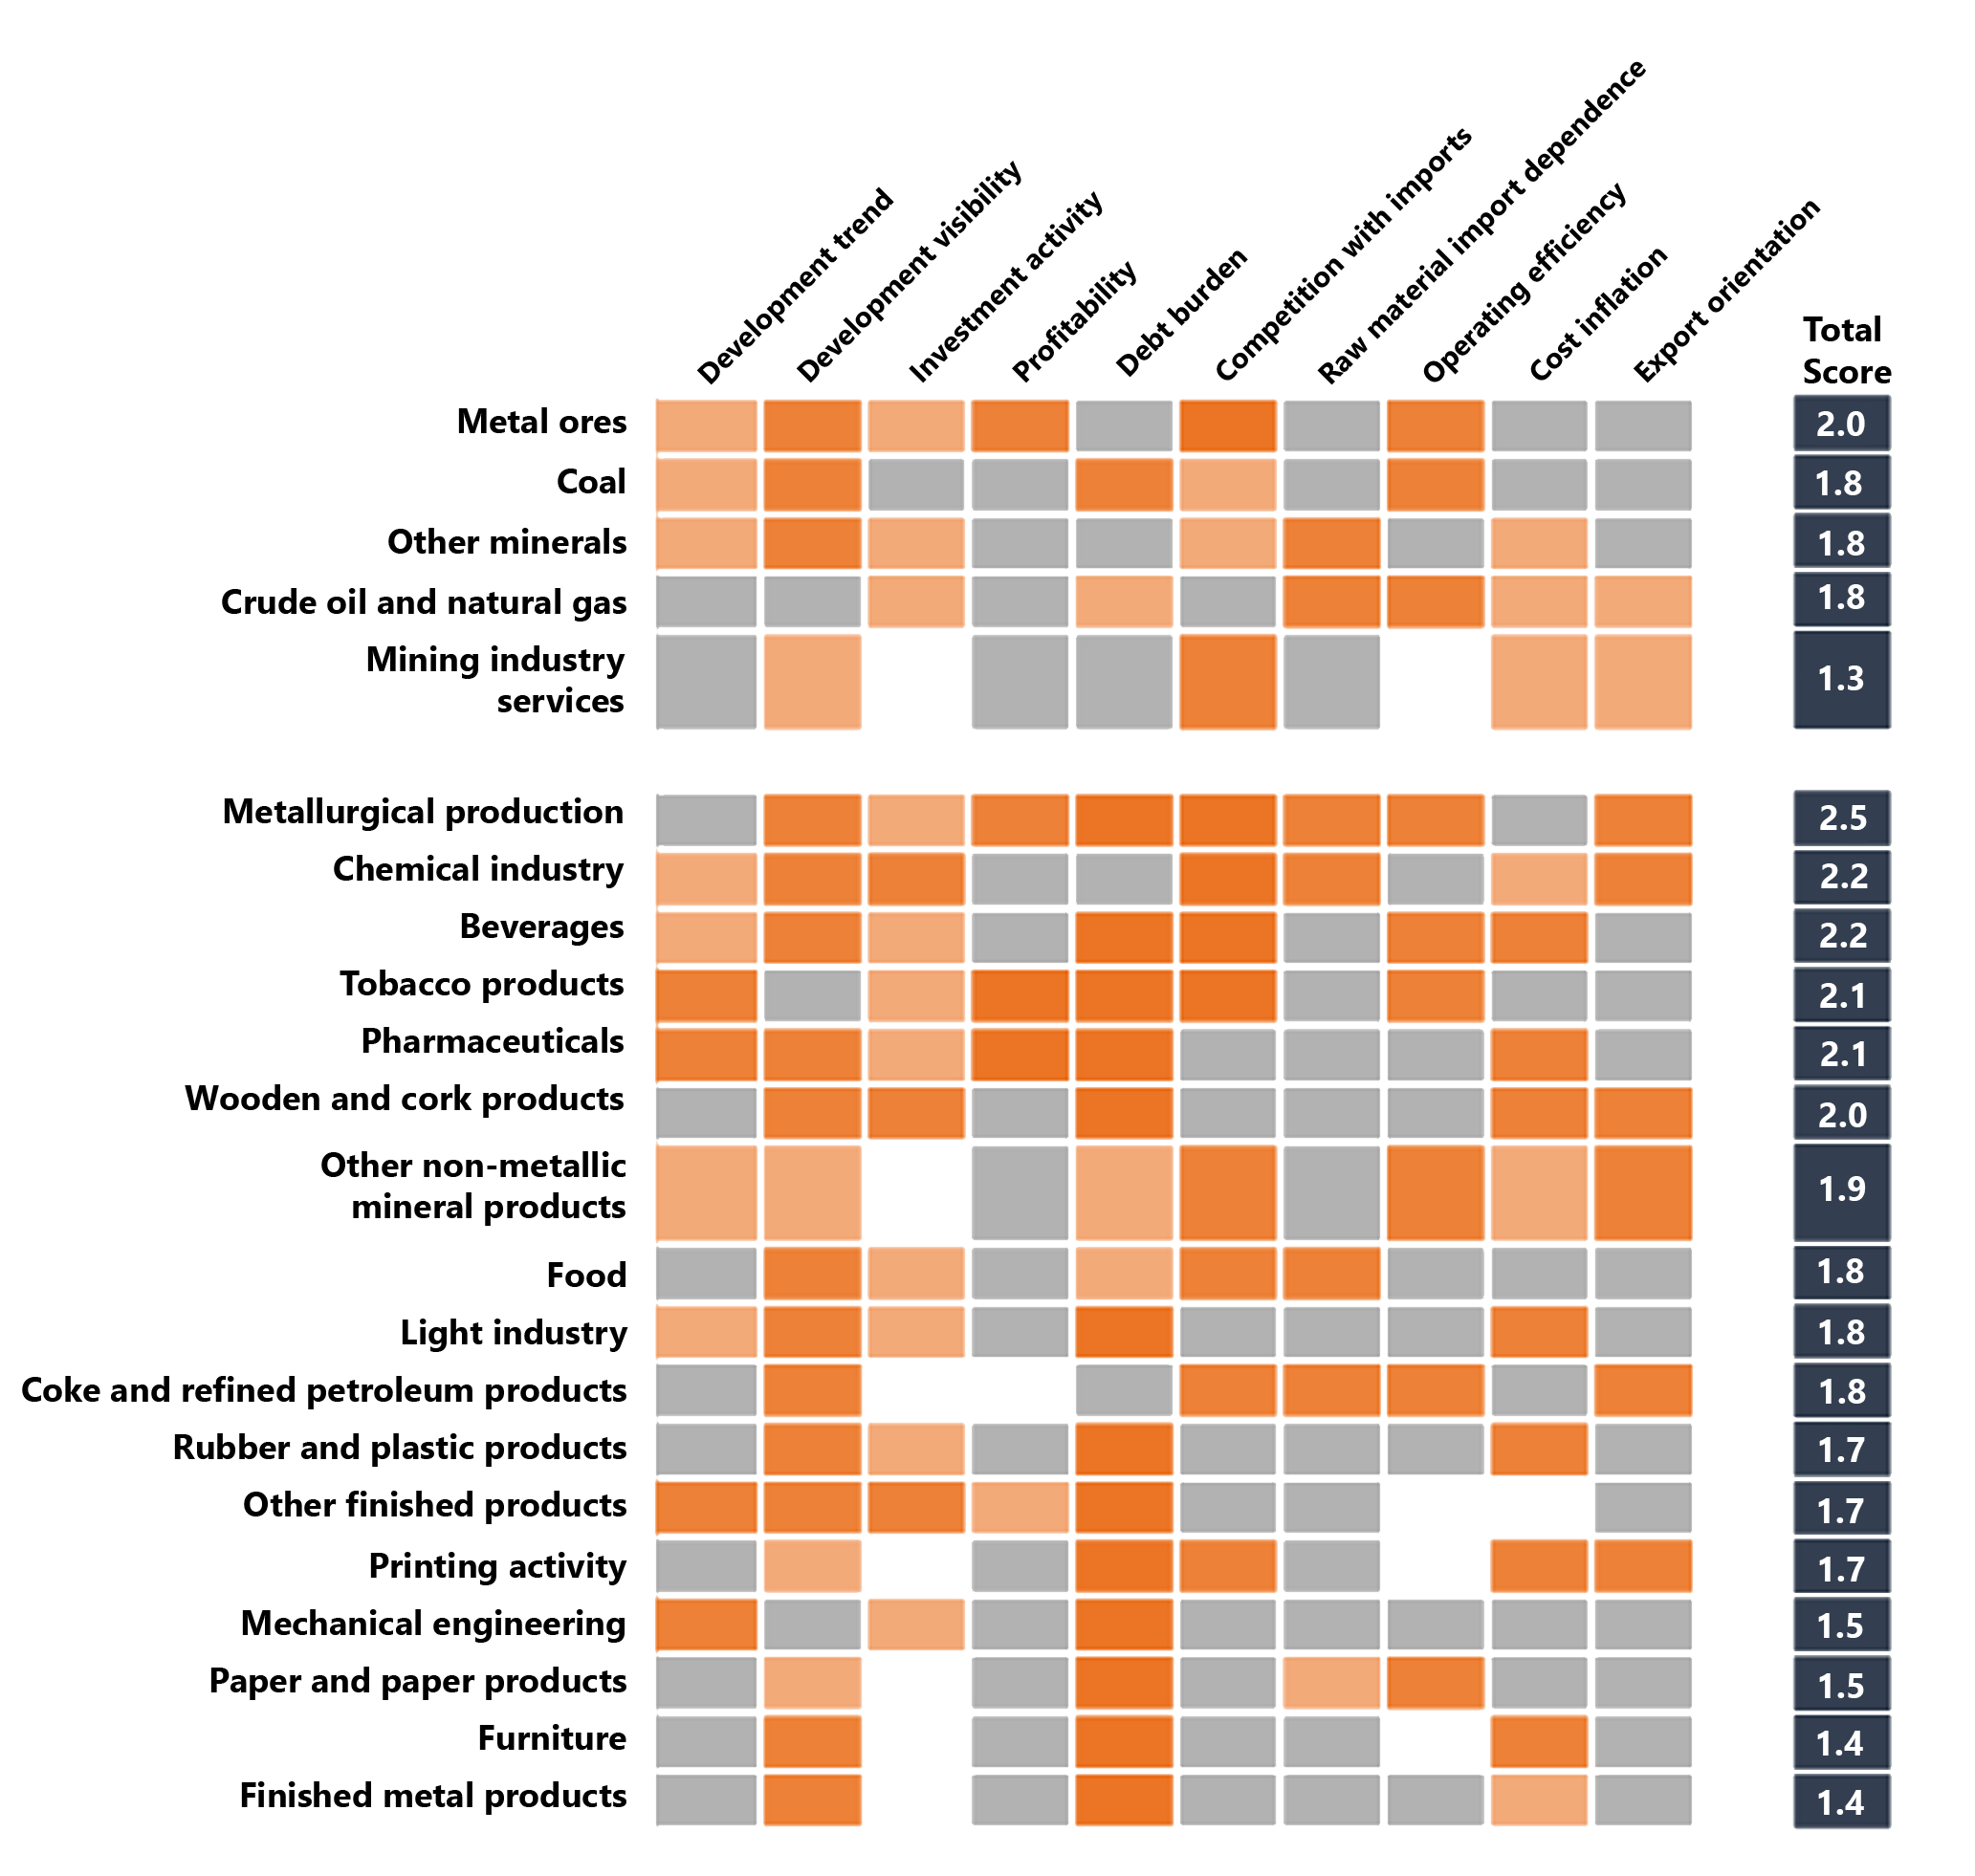
Jusan Analytics team has developed an additive scoring model to identify the key drivers of the industry.
Scoring highlightes the most viable and efficient industry segments and gives a certain understanding of the problematic aspects of domestic production through the identification of outsider sectors.
Industry subsectors are evaluated according to 10 unique criteria. The subsector is determined by the first two values of the Common Classifier of Economic Activity (CCEA) structure.
- Each criterion is measured by a coefficient, that is calculated using the Bureau of National Statistics (BNS) data. We have used the average value of the period from 2018 to 2022 in the calculation to smooth out unnecessary fluctuations.
- Each subsector criterion result is compared with the indicator of the corresponding sector. Then each subsector is assigned from 0 to 3 points:
- 3 points: the subsector exceeded the maximum value of the corresponding sector from 2018 to 2020;
- 2 points: the subsector exceeded the average value of the corresponding sector;
- 1 points: the subsector did not exceed the average value of the corresponding sector;
- 0 points*
- The assigned according to the criterion score is multipled by its share in the sector scoring. Each criterion has the same weight, since each of these criteria makes its own unique contribution to the development of production and the industrial sector as a whole.
- The results for all criteria are summed up, and the subsector is assigned a total score – the higher the score, the higher the rank of the subsector in the corresponding sector.
* if there is no data on the coefficient 0 points are also assigned
Main conclusions
Our scoring has revealed the key drivers of the industry. The most stable subsector in the primary sector was the extraction of metal ores: high indicators of development visibility, profitability, competition with imports and operational efficiency. In the secondary sector, was turned out that metallurgical production is the main driver: strengths were noted in terms of profitability, debt burden, competition with imports and operational efficiency. Further development of metal ore mining and metallurgical production will lead to an increase in the overall performance of the industrial sector.
And we have also identified less stable subsectors of the industrial sector. The subsector for rendering services in the mining industry in the primary sector turned out to be an outsider, in the secondary sector – the subsector for the production of finished metal products. The stimulation of these subsectors will allow a multiple increase in the overall of the industrial sector output level and indicators of the industrial sector development as a whole.
Read more in the paper
July 14, 2022
IndustryRelated News
09 October 23
How not to be unemployed: what you need to know about the future labour market
Experts of the World Economic Forum (WEF) presented new forecasts for business, professions and skills development in the next 5 years. The study is based on surveys of the largest employers and their expectations regarding business development, professions and skills. The survey involved 803 companies employing more than 11.3 million people, covering 27 industry clusters and 45 economies worldwide.
Key insights:
- Employers expect structural changes in 23% of jobs;
- The "green" economy is the main source of new jobs;
- Economic challenges are the greatest threat to the labour market;
- Advanced technologies will remain a key driver in business transformation;
- About 75% of the surveyed companies plan to implement AI by 2027;
- Up to 43% of all business tasks will be performed by machines in the coming 5 years;
- The most popular profession is artificial intelligence and machine learning specialists;
- Analytical thinking is a key skill for a successful career;
- 47% of the surveyed employers evaluate their skills when selecting candidates, and 45% require a diploma;
- In the next five years, 44% of the basic skills of employees will become obsolete and 6 out of 10 employees will have to undergo training.
One-off Researches
Businesslabour marketAlexandra Molchanovskaya
06 September 23
Financial analytics: How much do we spend on routine expenditures?
We face a variety of expenses that vary depending on our needs, circumstances and preferences in our daily lives. Some people need quality food, others need to repay loans regularly and for some entertainment and recreation become a priority. However, the question often arises: Do we have enough income to meet all these needs? What amount of money is needed to achieve a comfortable standard of living? Is it possible to classify yourself as middle class by your expenses?
In this regard, we decided to analyze the core expenditures that each person or family needs to achieve a minimum level of comfort and meet basic life needs. As a result of the study, we divided the employees of Astana and Almaty cities into 6 groups depending on their income and expenses and also determined the size of each class: the least well-off, low-income, lower middle class, middle class, prosperous and well-off.
Key insights:
- An average of 246.3 thousand tenge or 60% of salary is spent on core expenditures every month.
- The largest amount of daily expenses is observed in the first 4 days after receiving a wage.
- At least 450 thousand tenge per month is required to satisfy all basic needs for a comfortable life in megapolicies.
- Almost half of the employed in Astana and Almaty cities (49%) do not have enough earnings to cover their daily expenses.
- The is an essential disparity between workers and cities - there are 4 times more workers with financial difficulties in Almaty than in the capital.
- Only 4.4% of employees with wages from 700 thousand to 1.2 million tenge, whose daily expenses account for 40-50% of income, can be attributed to the middle class.
- Employees with above-average incomes make up the smallest share of the employed population - 2%.
One-off Researches
Standard of livingConsumptionAlexandra Molchanovskaya
Sign Up for the Most Helpful Mailing List